
IELTS Academic Writing Task 1: Cambridge 13 Test 2; column graph/bar chart on households owning and renting accommodation; with methods and model answer
This IELTS Academic Writing Task 1 post deals with a column graph/chart sample from Cambridge IELTS Series 13 Test 2. In this post you will find a short discussion on the methods of writing on this task and a great sample answer. We shall also look at a band 6.0 answer by a student and analyze it carefully. You will also find some bonus tips on writing task 1.

So, let’s have a look at the question first.
You should spend about 20 minutes on this task.
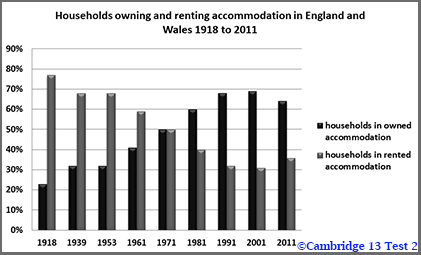
The chart below shows the percentage of households in owned and rented accommodation in England and Wales between 1918 and 2011.
Summarize the information by selecting and reporting the main features, and make comparisons where relevant.
Write at least 150 words.
Let’s take a look at a sample answer written by a student:
The given chart depicts the comparison of buying and or renting houses in England and Wales from 1918 to 2011.
In the year 1918 the rented house was raised about 78 percentage. Then it leveled of between 1939 to 1953. From 1961 to 1981 it dramaticaly droped to 35 percentage. The accommodation stated the same until 2001. In 2011 there was a slight increase in rented households and it was up to38%.
The same year the owned ones has raise from 21% to 32% in 1918 to 1953. In 1939 to 1953 the was a graduate stade in the percentage. Then it starts to leveled up to 69% In 1991. At 2001 to 2011 there was a decline in the owned accommodation and it was 62%.
Genarally, both of the rented and owned households has raised and droped throug the years from 1918 to 2011. The was a yeas that the same percentage and it was 1971 which 50%.
Examiner’s report:
The candidate was successful to identify all the main features and trends, including the similar trend that was noticed in 1971 for both items. Almost all the comments are supported by dates and percentages of households and an overview was also provided at the end of the answer. Organization looks clear as the writer dealt with each category in turn.
Though the candidate tried to use a range of vocabulary, some simple words had serious spelling errors (dramatically, dropped, stade, Generally, through, yeas, etc.) which at times made the answer look confusing. A mix of grammatical structures and some complex sentence forms can be found, yet they are inaccurate in different places.
The candidate is, therefore, given a band score of 5.5.
Now let’s take a look at another answer which is more organized and grammatically accurate. Here is a model answer that is expected to get a band score of 8.0.
Model answer to follow:
The displayed chart illustrates the share of households for some owned and rented accommodations in two countries (England and Wales) from 1981 to 2011.
As an overall trend, the proportion of households in rented accommodation was greater than the percentage of households in owned accommodation during the first half of the timeline. The maximum percentage of households in owned accommodation was in 2001 and the percentage of households in rented accommodation remained the lowest. However, the largest percentage of households for rented accommodation was in 1918 while the percentage of households for owned accommodation was the minimum. Additionally, households in both owned and rented accommodations had the same proportion in 1971.
In 1981, households in owned accommodation were approximately 23%. It developed to almost 32% in 1939 and in 1953 it was constant. Then, it improved significantly from about 32% to 69% between 1939 and 2001. However, it slightly dropped to about 64% in 2011.
As far as households in rented accommodation were concerned, 1918 was the boom year with nearly 78% which started to drop afterward. Though it remained constant at around 68% between 1939 and 1953, it continued to go down and reached only 30% in 2001. In the year 2011, it slightly increased to around 36%.
(203 words)
Expected band score: 7.5
Bonus tips:
In the IELTS Writing Task 1, the examiners do not look at how accurate calculations you have done because it is a language test. If you want to score well, you should give more importance to the language skills such as lexical resources or vocabulary, grammar (mostly compound and complex sentences), comparisons, paragraphing, etc. These are the places where you will be marked. So, give more importance to these areas. You should present accurate data (let’s not deny it), but more marks are there for you in presenting your language skills.

Wonder full alobration…
Thank you!
Welcome!
Some mistakes have in this sample answer
YES, Mr Mofijur, the first answer is by a student. Take a look at the end of the post. You’ll find a 8.0-standard sample answer.
osm content
Thank you.
Would you able to subscribe to my YouTube Channel as well and bring some subscribers too? http://www.youtube.com/c/IELTSDeal
There is a mistake in last line of 8 bands expected sample. You have already explained about 2001 but in the end again written about 2001 with wrong percentage of 36% which is actually of 2011.
I’ve fixed it!
In that model answer 3rd paragraph it’s should be 1918 right?
The given bar chart compares the proportion of owned and rented households in England and Wales from 1918 and 2011. It is evident that both the scenario has opposing trend during given timespan.
In 1918, people’s approach for owned accommodation was lesser. That was around 22% and rented accommodation approach was better choice as that was choice of rest of the people. However, trend was totally different after that. owned house interest started to grow and that of rented house was becoming lesser. During 1971, both the approach reached at same level of 50% and trend continued for 40 more years and in 2001 it was totally opposing scenario compare to 1918. 69% people has been noted for owed house approach and 31% for rented house. However next 10 years from that trend changed again and showed decline again for owned accommodation and rise for rented accommodation.
Overall, is is clearly seen that people’s approach for accommodation has totally changed with the time.
Thank you for all these comparison and suggestion
Welcome! I Hope this helps you!
There are some grammar mistakes in the second version of the writing task, therefore, it is not likely to be regarded as Band 8 essay
The grammatical mistakes were carefully analysed and solved accordingly. Still, if you have any insights, please feel free to suggest.