Academic IELTS Writing Task 1: Vocabulary for line graph/column graph
It’s really important to learn vocabulary for Academic IELTS Writing Task 1, to explain the graphs and charts. You must use a satisfactory number of standard words and you cannot repeat them regularly in the same answer. If you use the same words over and over again, you will be penalized for your lacking of vocabulary. On the other hand, using good and some complex words can reward you with a good band score. Using some different vocabulary is not so difficult and practicing them in short sentences can develop your skills in this case. So, here is a simple word list that you can use in Writing Task 1. Use it and get good marks!
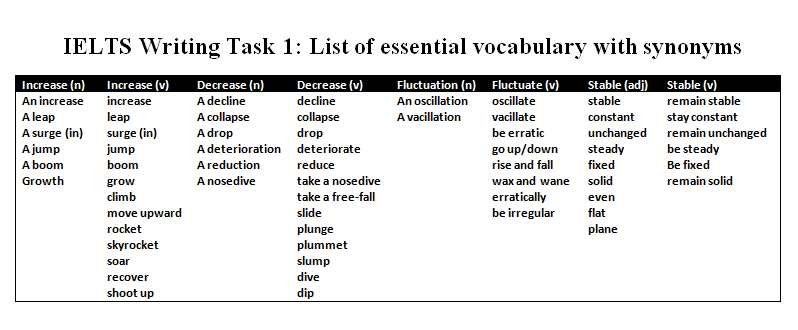
Let’s take a look at some example sentences using some of this vocabulary. All these sentences can be used in different Task 1 graphs and charts. You may need to change the sentences according to the Task 1 question you are practicing. Follow the italic words/phrases which are the vocabulary we are practicing here.
- There is an increase in the price of the commodities between June and July each year.
- The percentage jumped from 40 to 90.
- A sharp decline was observed during the following three years.
- The number of students soared from 500 to 4500 in 1960.
- Admission to X college deteriorated from 1500 to 300 only.
- The population of Bransfield took a nosedive to 350 approximately.
- An oscillation is seen in the middle of the graph, between 1998 and 2001.
- The percentage was erratic during the 1980s.
- The number of sales did not change until 2017.
- It remained constant for the next 5 years.
- The percentage was fixed at 76 till 2013.
- There was a growth in the amount, after a small collapse.
- Compared to the number of poultry farms in the eastern suburbs, which witnessed a plummet from 80,000 to 20,000 in 2015, the quantity in western towns boomed to 120,000 in the same year.
- The number of workers in the company rocketed to 2050 between 2014 and 2016.
- The rate of sales profit plunged to $2000.
- The share of both Sydney and Melbourne did not change at all for the following years.
Take a close look at all the given example sentences. You can practice using every word in different sentences. Then you can target a Task 1 question and try to use the words. Always make sure that your essay writing is checked by an expert. He or she can show you your mistakes which you can correct later on.
Flow-chart on sweater manufacturing
Process diagram on olive oil production
Two maps showing changes in an industrial village
Two maps showing changes in a town
Life cycle diagram on silkworm moth
Cycle diagram on water movement
Diagram on water contamination


Sir, very helpful post:) 🙂
Especially for newbies of IELTS!!!
You are most welcome.